A) 7
B) 8
C) 9
D) 10
F) A) and C)
Correct Answer

verified
Correct Answer
verified
Multiple Choice
Figure 10-18. The graph represents a corrective tax to reduce pollution. On the axes, Q denotes the quantity of pollution and P represents the price of pollution. 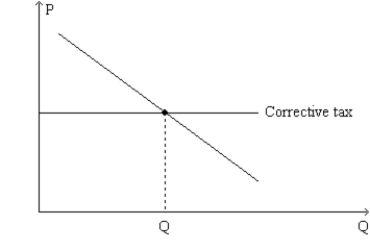 -Refer to Figure 10-18. The line labeled "Corrective tax" could accurately be relabeled as
A) "Demand for clean air."
B) "Demand for pollution rights."
C) "Price of pollution."
D) "Rate of subsidy."
F) None of the above
Correct Answer

verified
Correct Answer
verified
Multiple Choice
Figure 10-3 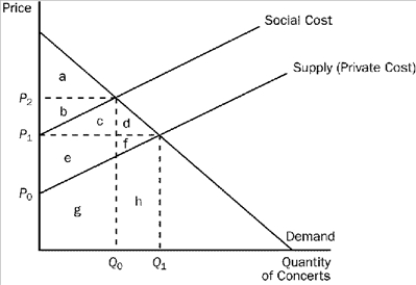 -Refer to Figure 10-3. At the private market outcome, the equilibrium price will be
A) P0.
B) P1.
C) P2.
D) None of the above is correct.
F) A) and B)
Correct Answer

verified
Correct Answer
verified
Multiple Choice
The supply curve for a product reflects the
A) willingness to pay of the marginal buyer.
B) quantity buyers will ultimately purchase of the product.
C) cost to sellers of producing the product.
D) seller's profit from producing the product.
F) None of the above
Correct Answer

verified
Correct Answer
verified
Multiple Choice
Which of the following statements is correct?
A) Government should tax goods with either positive or negative externalities.
B) Government should tax goods with negative externalities and subsidize goods with positive externalities.
C) Government should subsidize goods with either positive or negative externalities.
D) Government should tax goods with positive externalities and subsidize goods with negative externalities.
F) C) and D)
Correct Answer

verified
Correct Answer
verified
Multiple Choice
Figure 10-19 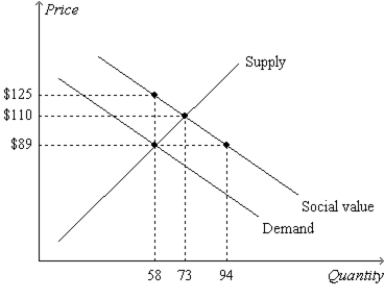 -Refer to Figure 10-19. Note that the lines labeled "Demand" and "Social Value"are parallel. Also, the slopes of the lines on the graph reflect the following facts: (1) Private value and social value decrease by $1.00 with each additional unit of the good that is consumed, and (2) private cost increases by $1.40 with each additional unit of the good that is produced. Thus, when the 74th unit of the good is produced and consumed, social well-being
A) decreases by $2.40.
B) decreases by $1.60.
C) increases by $1.00.
D) increases by $1.40.
F) A) and C)
Correct Answer

verified
Correct Answer
verified
Multiple Choice
Regulations to reduce pollution
A) cause pollution levels to drop below the regulated amount.
B) are a more costly solution to society than a corrective tax.
C) allow firms with the lowest cost to reduce pollution by more than those with highest costs.
D) are a better solution for the environment than a corrective tax.
F) None of the above
Correct Answer

verified
Correct Answer
verified
Multiple Choice
Figure 10-16 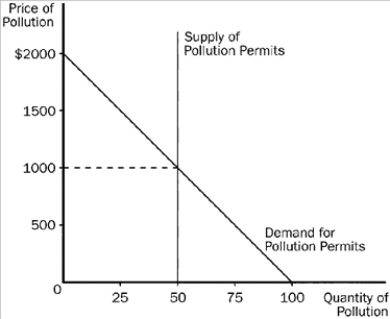 -Refer to Figure 10-16. This graph shows the market for pollution when permits are issued to firms and traded in the marketplace. The equilibrium price of pollution is
A) $50
B) $500
C) $1,000
D) $2,000
F) C) and D)
Correct Answer

verified
Correct Answer
verified
Multiple Choice
Negative externalities lead markets to produce
A) greater than efficient output levels and positive externalities lead markets to produce smaller than efficient output levels.
B) smaller than efficient output levels and positive externalities lead markets to produce greater than efficient output levels.
C) greater than efficient output levels and positive externalities lead markets to produce efficient output levels.
D) efficient output levels and positive externalities lead markets to produce greater than efficient output levels.
F) B) and C)
Correct Answer

verified
Correct Answer
verified
Multiple Choice
Table 10-4  -Refer to Table 10-4. The last unit of output for which private value exceeds social cost is the
A) 2nd unit.
B) 3rd unit.
C) 4th unit.
D) 5th unit.
F) A) and D)
Correct Answer

verified
Correct Answer
verified
Multiple Choice
Corrective taxes differ from most taxes in that corrective taxes
A) reduce economic efficiency.
B) do not raise revenue for the government.
C) do not cause deadweight losses.
D) always result in a high burden on sellers of goods to which the corrective tax applies.
F) B) and D)
Correct Answer

verified
Correct Answer
verified
Multiple Choice
When negative externalities are present in a market
A) private costs will be greater than social costs.
B) social costs will be greater than private costs.
C) only government regulation will solve the problem.
D) the market will not be able to reach any equilibrium.
F) B) and C)
Correct Answer

verified
Correct Answer
verified
Multiple Choice
An externality
A) results in an equilibrium that does not maximize the total benefits to society.
B) causes demand to exceed supply.
C) strengthens the role of the "invisible hand" in the marketplace.
D) affects buyers but not sellers.
F) A) and C)
Correct Answer

verified
Correct Answer
verified
Multiple Choice
Corrective taxes are typically advocated to correct for the effects of
A) positive externalities.
B) negative externalities.
C) patents.
D) All of the above are correct.
F) A) and D)
Correct Answer

verified
Correct Answer
verified
Multiple Choice
If education produces positive externalities and the government does not intervene in the market, we would expect
A) the equilibrium price to be higher than the optimal price.
B) the equilibrium quantity to be lower than the optimal level.
C) the equilibrium quantity to be higher than the optimal level.
D) both a and b are correct
F) B) and C)
Correct Answer

verified
Correct Answer
verified
Multiple Choice
Suppose planting flowering shrubs creates a positive externality equal to $7 per shrub. Further suppose that the local government offers a $7 per-shrub subsidy to planters. The number of shrubs that are planted is then
A) less than the socially optimal quantity.
B) greater than the socially optimal quantity.
C) equal to the socially optimal quantity.
D) There is not enough information to answer the question.
F) A) and D)
Correct Answer

verified
Correct Answer
verified
True/False
Buyers and sellers neglect the external effects of their actions when deciding how much to demand or supply.
B) False
Correct Answer

verified
Correct Answer
verified
Multiple Choice
Figure 10-16  -Refer to Figure 10-16. This graph shows the market for pollution when permits are issued to firms and traded in the marketplace. The equilibrium number of permits is
A) 50
B) 100
C) 1,000
D) 2,000
F) None of the above
Correct Answer

verified
Correct Answer
verified
Multiple Choice
Figure 10-10 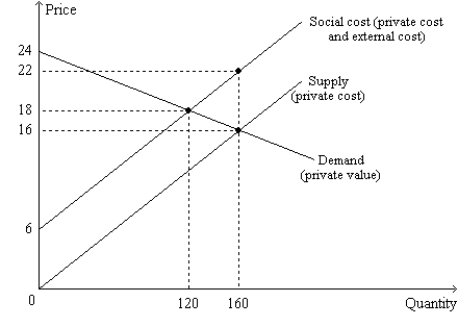 -Refer to Figure 10-10. Which of the following statements is correct?
A) The private cost of producing the 120th unit of output is $12.
B) The social cost of producing the 120th unit of output is $22.
C) The external cost of producing the 120th unit of output is $2.
D) All of the above are correct.
F) All of the above
Correct Answer

verified
Correct Answer
verified
True/False
In some circumstances, selling pollution permits may be better than levying a corrective tax.
B) False
Correct Answer

verified
Correct Answer
verified
Showing 441 - 460 of 524
Related Exams